Server monitoring is the process of monitoring a server's system resources like CPU Usage, Memory Consumption, I/O, Network, Disk Usage, Process etc. Server Monitoring metrics also helps in capacity planning by understanding the server's system resource usage. A server monitoring tool helps in automating the process of server monitoring. Monitoring server performance also helps in identifying other performance related issues like resource utilization, app downtime and response time.
Why is it important to monitor server performance?
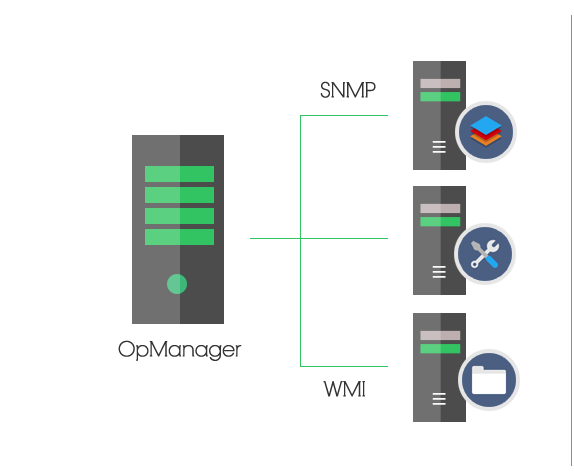
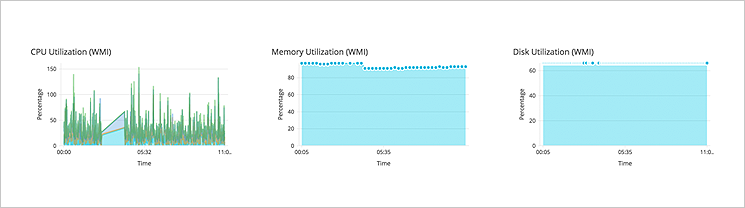
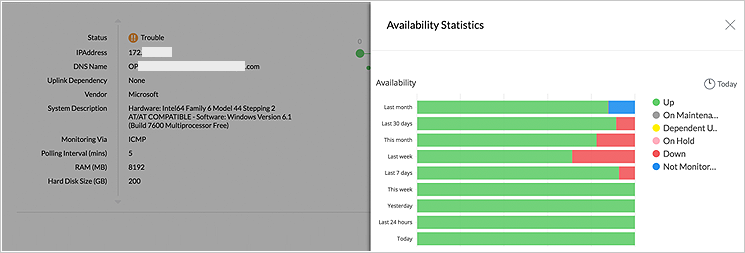
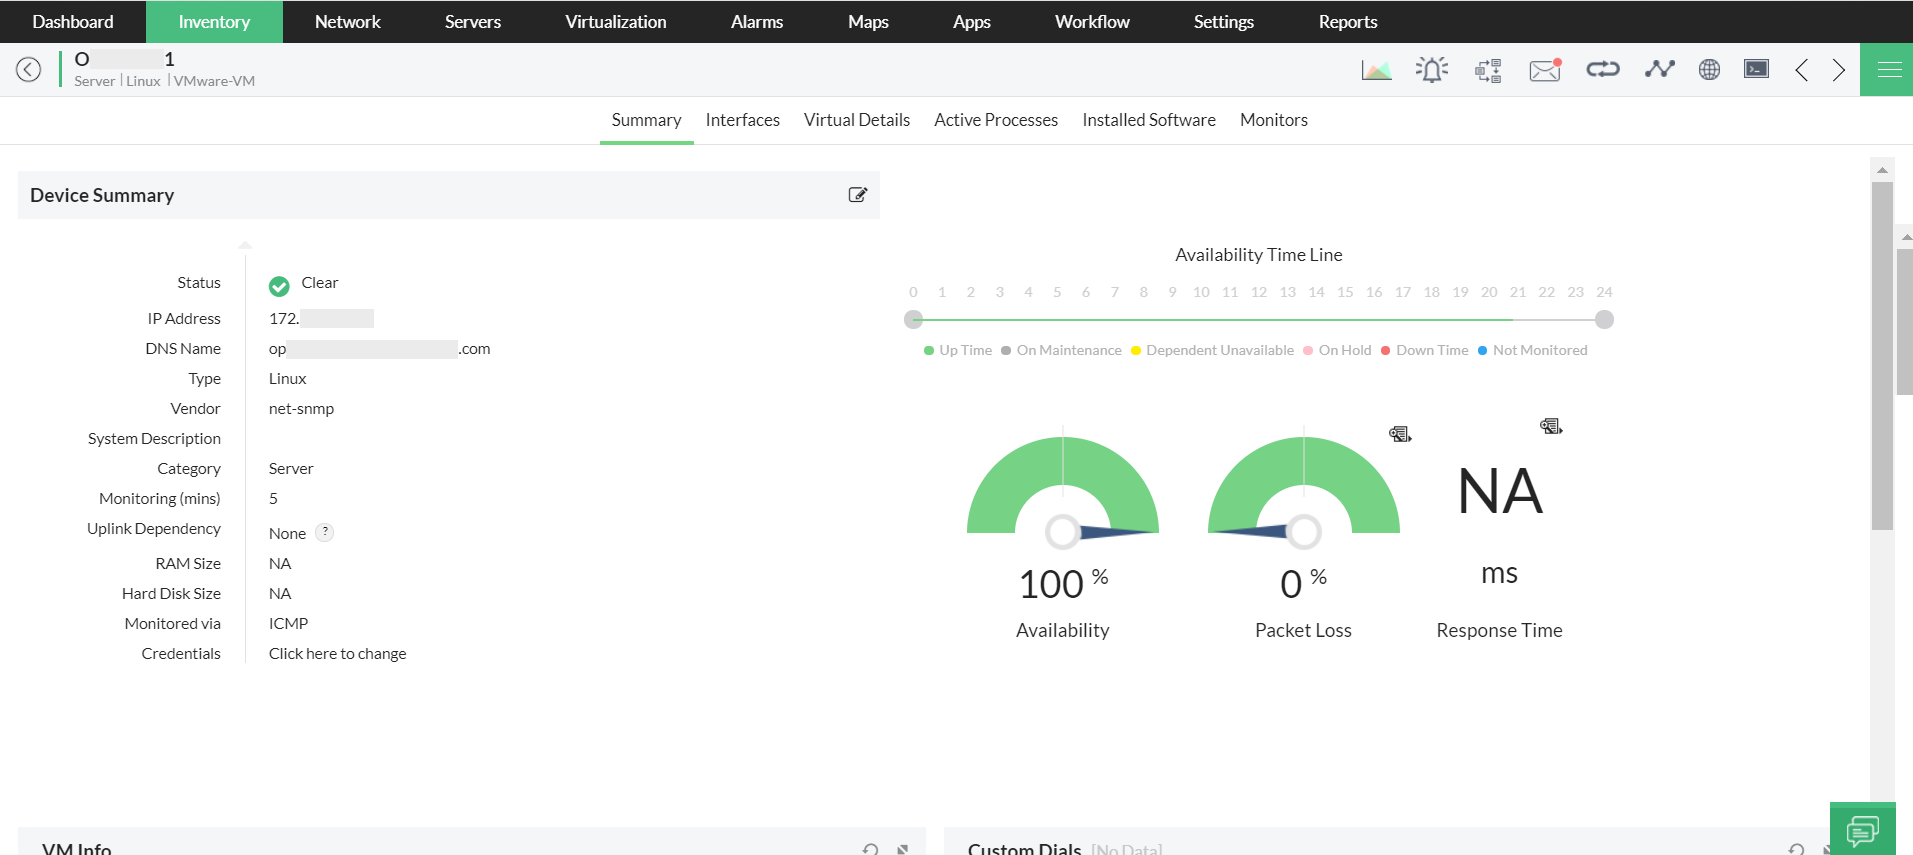
OpManager provides multi vendor support to Monitor Server and all their critical applications continuously along with their services and processes. It periodically monitors servers via SNMP and WMI protocols to ensure that they are up and running at their optimum performance level, 24x7. It stores all the data for historical performance tracking and troubleshooting, thus eliminating the need for multiple server monitoring tool. Get in-depth insights in real time and monitor server performance effectively with OpManager.
Learn how to monitor the critical parameters of your server effortlessly with OpManager.
Register for a personalized demo now!
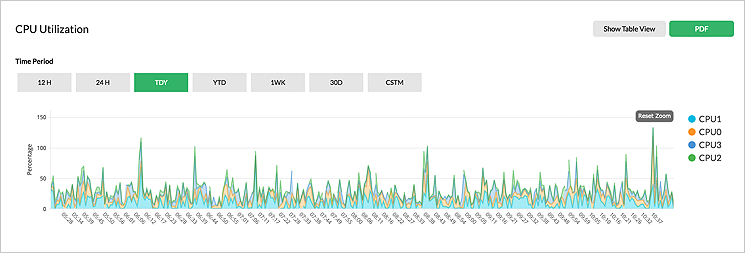
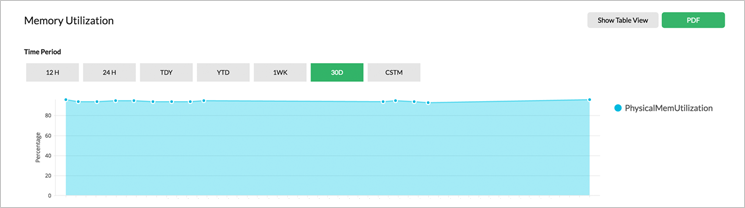
OpManager, one among the leading server performance monitoring tools, offers several out-of-the-box features such as server availability monitoring and more than 300 performance metrics such as page read/write, processor queue length, free physical memory, disk I/O, process queue length through SNMP and WMI protocols. OpManager's server uptime monitoring feature helps you keep tabs on the availability of all physical and virtual servers 24x7. You can monitor critical performance metrics every minute and detect performance issue at its early stage by using powerful features like server monitoring dashboards. Apart from the default monitors, you can also create your own custom monitors using server monitoring dashboard template. All the collected data of the server performance metrics are stored in the database for detailed analysis and for creating monthly and yearly performance reports.
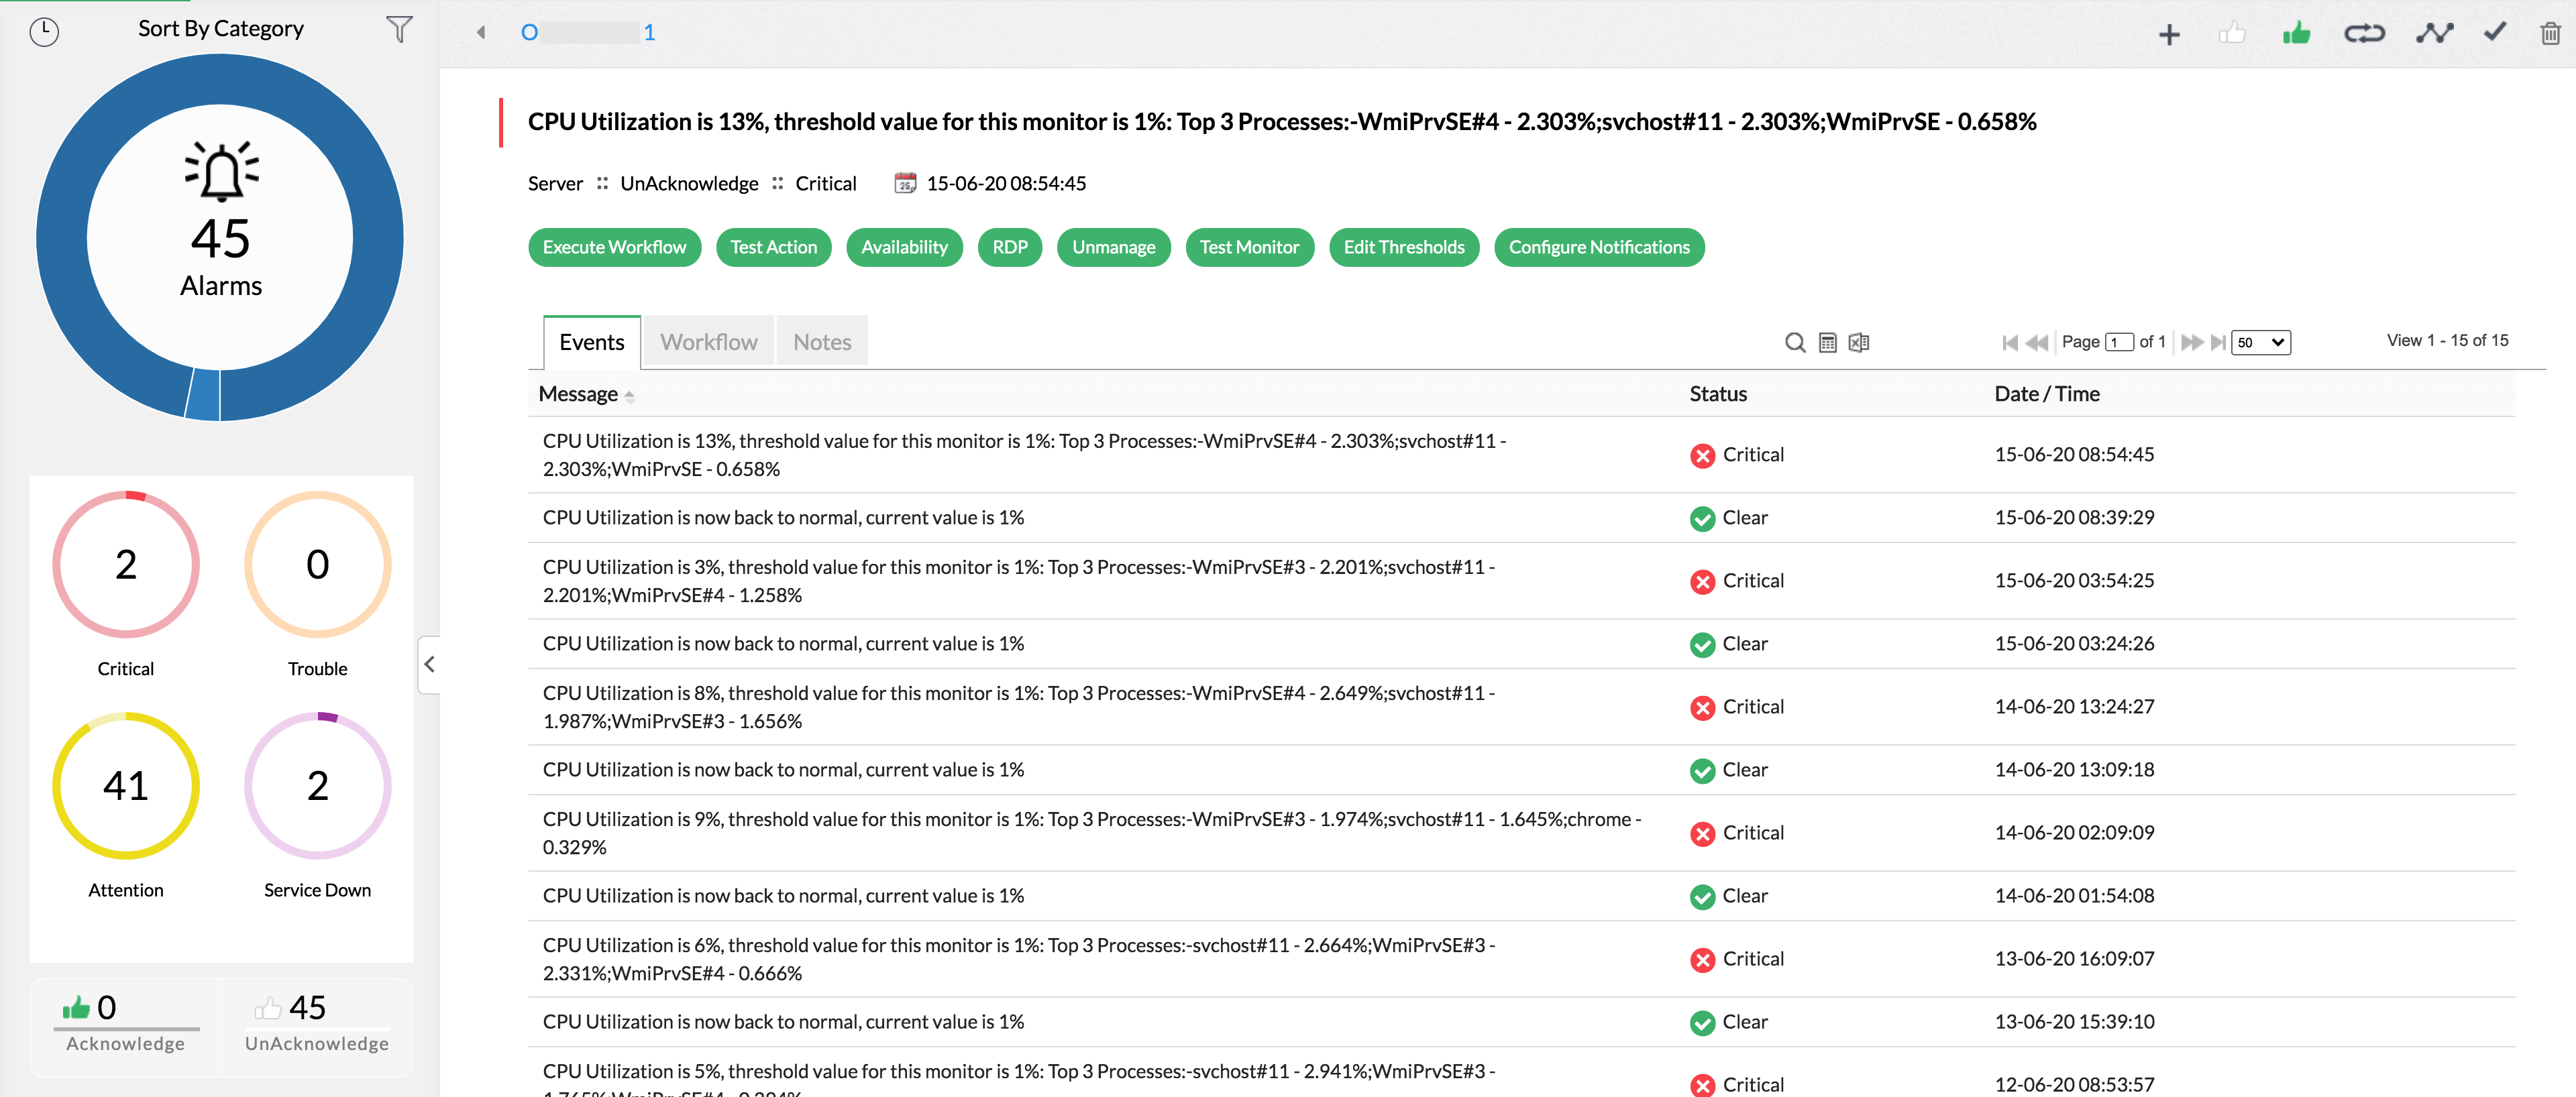
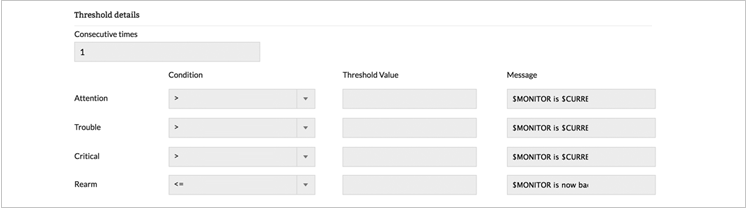
In IT, more than 50% of the issues are reported by end users and it is not a healthy approach. Server monitor should identify any performance related issue at the early stages and notify the IT team. OpManager, the best-in-class server monitoring software, offers proactive server monitoring using multiple thresholds. It allows you to check performance at various levels and notify the same through email and SMS when it is violated.
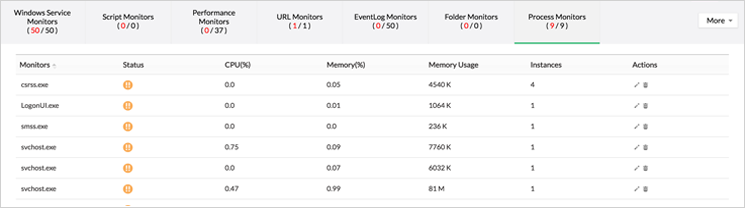
When it comes to business-critical applications, you don’t want to leave any stone unturned. OpManager offers advanced server monitoring services and monitors processes and Windows services, with most of the discovery and monitoring done out-of-the-box. OpManager can even detect attempted security break-ins over your application servers (login failures due to bad passwords, account lockouts, failed attempts to access secure files, etc.) by processing Windows Event logs & syslog monitoring.
OpManager includes support for virtual server monitoring. It provides an exclusive server monitoring dashboard for each ESX server, showing the CPU, memory and disk utilization for each guest VM instance on the ESX server. OpManager also provides options to Start, Stop and Suspend the VM instances on the ESX server. Get instant alerts on VMs using excessive resources and even remotely stop the VMs before they cause problems in the ESX server.
OpManager's server performance monitoring goes beyond basic server monitoring functionality to include support for SMTP, POP and IMAP on your Exchange servers. It monitors over 15 key services and 50 critical variables that include Public Store, Private Store, Received or Sent Queue Size, etc.. All this, over a specially crafted Exchange monitoring dashboard that automatically assigns performance monitors and preconfigured thresholds depending on whether the servers are Exchange 2000, 2003 or 2005.
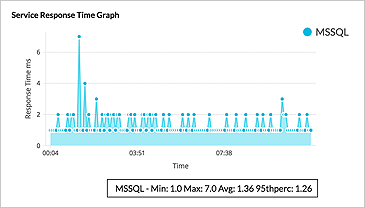
At the time of device discovery, OpManager discovers all the services running on your Windows & Linux servers and associates availability and response time monitors to these. OpManager also supports adding monitors for custom services running on TCP port.
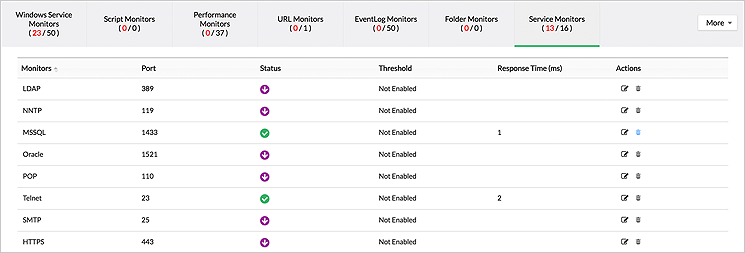
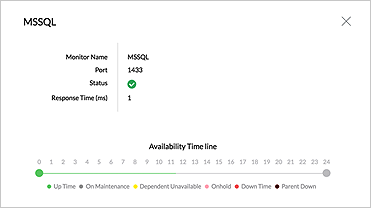
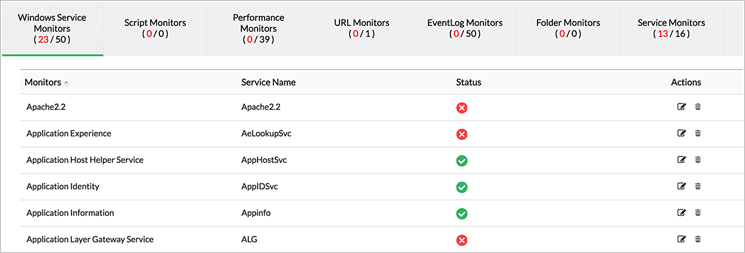
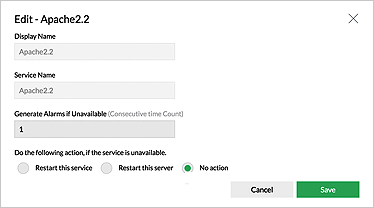
Apart from monitoring system level services like HTTP, LDAP, SMTP etc., OpManager also monitors Windows Services e.g. Alerter, FTP, Net Logon, DHCP Server, IAS, Print Spooler etc.. Once a monitored service is found to have failed, OpManager can be configured to automatically restart the Windows Service or even the server.

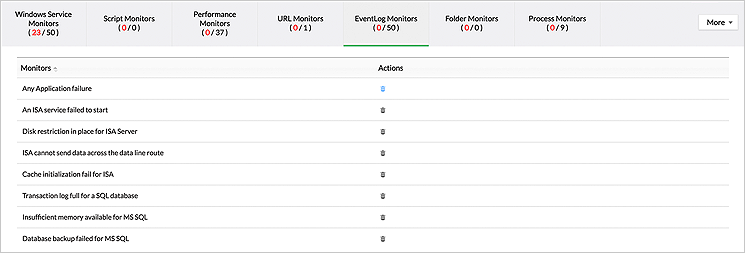
OpManager can help you detect failed logins due to bad passwords, account lockouts, failed attempts to access secure files, security log tampering etc. by processing Windows security Event logs. Besides security logs, OpManager can also monitor application logs (out of the box rules for Exchange, IIS, MS–SQL and ISA servers), system logs and other event logs.
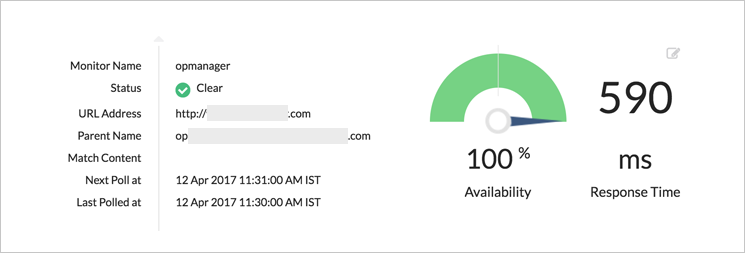
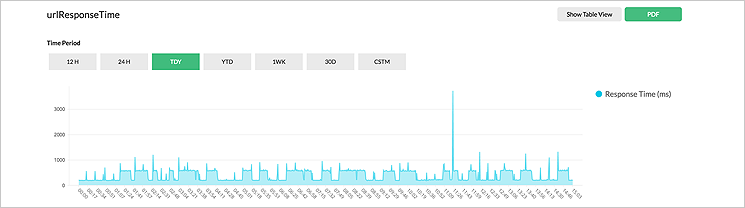
Simply relying on availability and response time (TCP Port) checks won’t help you know if your website has been compromised. OpManager allows you to monitor a URL and search for a specific text on the page. When the text is missing you can be immediately alerted and you get to know in real time that your website has been compromised. OpManager’s website monitoring supports HTTP⁄ HTTPs and NTLM Authenticated sites.
OpManager, the real time server monitoring software also supports remote server monitoring which helps you to monitor servers across multiple locations. You can also remotely monitor and kill processes which affect the server performance. Monitoring server remotely can help you remediate performance issues and perform server troubleshooting actions like rebooting or restarting a server anywhere across the globe.
 Recognized in the Capterra Shortlist 2023 for the category Network Monitoring Software.
 Recognized in the Software Advice Front Runners report 2023 on Network Monitoring Tools.
 Recognized in the GetApp Category Leaders 2023 for Network Monitoring.